Category: Consulting

  • India What a Decade of Borrowing Actually Bought Us. Are we in a Debt Trap?

    India What a Decade of Borrowing Actually Bought Us. Are we in a Debt Trap?

    India’s Public Debt Story (2015โ€“2025): What a Decade of Borrowing Actually Bought Us. Are we in a Debt Trap?

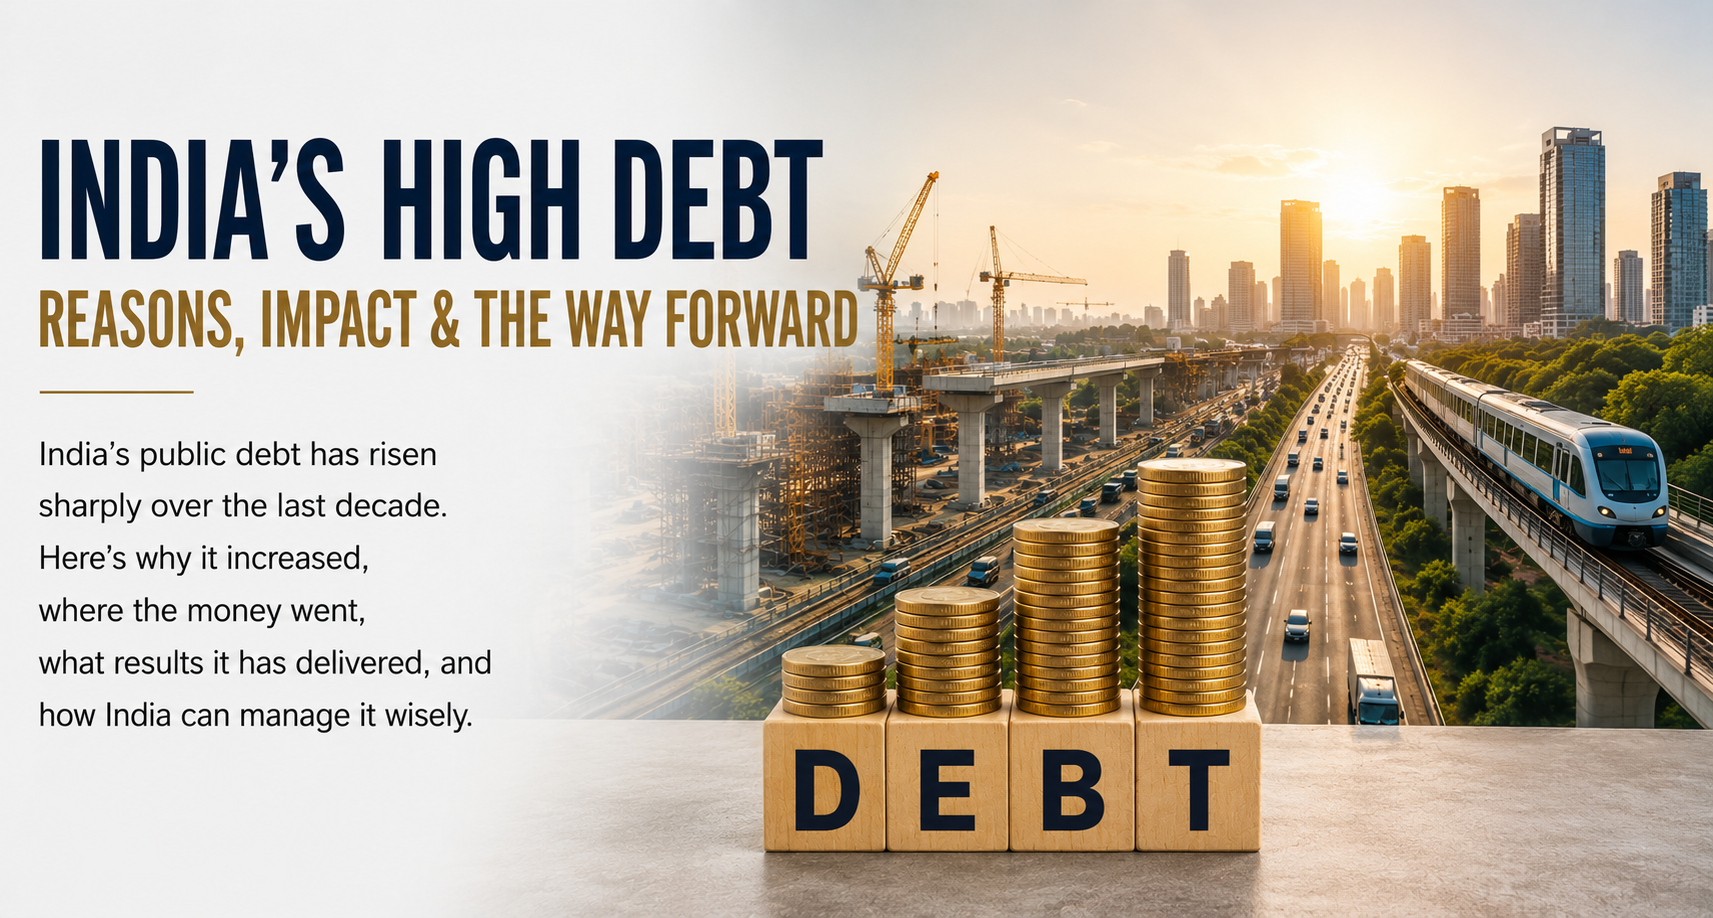
    India’s combined government debt has roughly doubled over the past decade. Central government debt alone climbed from about โ‚น121 trillion in FY2020 to an estimated โ‚น197 trillion by FY2026. State liabilities nearly tripled, from ~โ‚น32.6 trillion in FY2016 to ~โ‚น94 trillion by FY2025.

    Numbers like these trigger one of two reactions: alarm or indifference. Neither is entirely right.

    The better question is: What drove this rise, where did the money go, and where does it leave India today?

    Here’s the decade, unpacked.

    The pattern: steady drift, then a shock, then a slow climb-down

    Pre-2020, India’s fiscal deficit sat in a fairly disciplined 3โ€“4% of GDP band, broadly consistent with FRBM targets โ€” even if actual numbers occasionally missed the mark (FY2019 came in around 3.4% against a 3.3% target).

    Then COVID hit. The central fiscal deficit spiked to roughly 9.5% of GDP in FY2021 as revenue collapsed and emergency spending โ€” cash transfers, free food grain, MSME credit guarantees, health spending โ€” went out the door. Debt-to-GDP jumped by an estimated 8โ€“10 percentage points in a single year.

    Since then, the story has been consolidation: the deficit has been brought down to around 5โ€“6% of GDP, with a budgeted target of 4.4% for FY2026. It’s real progress, even if the debt base it’s working off is now structurally higher than it was five years ago.

    Three episodes that explain most of the swings Debt to GDP ratio %

    Demonetisation (Nov 2016): Intended to curb black money and push digital transactions, it also slowed activity and tax collections in the short run โ€” GDP growth cooled and the fiscal deficit widened modestly (to around 3.5% of GDP against a 3% target) in FY2017.

    GST rollout (Jul 2017): A genuine structural reform with long-term revenue upside, but the transition wasn’t free. Collections initially undershot expectations, and the Centre had to borrow to compensate states during the changeover โ€” nudging FY2018’s deficit above target.

    COVID-19 (2020โ€“21): By far the biggest driver. A relief package of โ‚น20 trillion, layered onto a collapsing revenue base, took the deficit from roughly 3.5% to 9.5% of GDP in one year. Was it worth it? Most independent analyses โ€” including from the IMF and RBI โ€” suggest yes: the counterfactual (a sharper austerity response) likely meant a materially deeper contraction. The trade-off was a permanently higher debt stock in exchange for a shallower recession.

    Add to this two smaller but persistent pressures: periodic PSU bank recapitalisation (roughly โ‚น2.2 trillion across FY2018 and FY2020, needed to clean up bad loans) and an expanding footprint of welfare and housing schemes (PMAY, Ujjwala, MGNREGA) that keep revenue spending elevated even as capital expenditure has also been rising.

    The quiet number that matters most: interest payments

    Debt totals get the headlines, but the number that actually constrains policy choices is the interest bill. Central government interest payments rose from about โ‚น6.6 trillion in FY2020 to roughly โ‚น8.1 trillion by FY2022 and now consume somewhere in the range of 20โ€“25% of central revenue receipts. That’s revenue that isn’t available for capex, subsidies, or further consolidation โ€” it’s simply the cost of past borrowing. As global and domestic interest rates moved up through 2022โ€“23, this burden has only gotten heavier.

    Where did the borrowed money go?

    It helps to separate how much India borrowed from what it was spent on. The story changed significantly after COVID:

    • FY2020โ€“21: Borrowing largely supported emergency needs โ€” food distribution, welfare support, MSMEs and bank recapitalisation. Necessary at the time, but with limited long-term growth impact.
    • FY2022โ€“24: The focus shifted toward capital expenditure โ€” roads, railways, healthcare and infrastructure. Capex as a share of GDP steadily increased.

    The positive shift: India increasingly moved from borrowing to support consumption toward borrowing to build productive assets.

    The road ahead

    The government’s own glide path targets a fiscal deficit closer to 4% of GDP, with debt-to-GDP expected to ease from its COVID-era peak (above 60%) toward the high-50s by FY2026. Getting there sustainably will likely depend on a few things playing out together: continued nominal GDP growth outpacing debt growth, disciplined targeting of subsidies rather than blanket cuts, tighter oversight of contingent liabilities and off-budget borrowing (state guarantees, PPP obligations), and a continued shift of the expenditure mix toward capital rather than revenue spending.

    None of this is dramatic. Fiscal consolidation rarely is โ€” it’s mostly the unglamorous work of holding a line over several budget cycles. But the direction, so far, has been the right one.

     The takeaway

    The last decade brought demonetisation, GST, COVID-19 and a major infrastructure push. As a result, India’s public debt is roughly twice what it was in 2016.

    But debt is only one side of the story. India also built a stronger digital payments ecosystem, a unified tax system and significantly better infrastructure, while managing a strong post-COVID recovery.

    The key question now isn’t how much India owes, but whether economic growth can continue to outpace the growth in debt.


    What’s your read โ€” was the post-COVID borrowing surge the right call, or did it set a debt base that will constrain policy for years to come? Would like to hear other perspectives on this.

    #IndianEconomy #PublicFinance #FiscalPolicy #Macroeconomics #Debt #Budget2026 #EconomicPolicy #India
  • India’s FDI Puzzle: Record Money In, Very Little Staying Back

    India’s FDI Puzzle: Record Money In, Very Little Staying Back

    India’s FDI Puzzle: Record Money In, Very Little Staying Back

    A simple, data-backed look at what’s really happening to foreign investment in India.

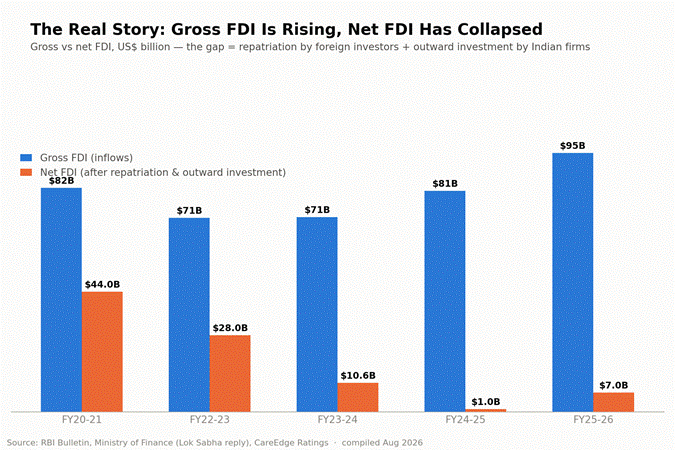
    Picture this: India just received its biggest-ever foreign investment cheque โ€” $94.8 billion in FY 2025-26. Worth celebrating, right? But once the dust settled, only $7 billion of that actually stayed back to build something in India. The rest walked right back out. And this isn’t a one-off โ€” it’s been the pattern for four years running. Here’s the simple version of what’s happening, why, and what India can do about it.

    1. Where Things Stand Today

    Two numbers matter here, and once you know the difference, the whole story becomes clear. Gross FDI is every dollar of foreign money that lands in India in a year. Net FDI is what’s left after two things get subtracted: money foreign investors pull back out (called repatriation โ€” they sell their stake, take dividends, or exit), and money Indian companies send abroad to invest in their own overseas ventures. Net FDI is the honest number. It’s the capital that’s actually staying and creating jobs and factories here.

    YearGross FDI InNet FDI (Actually Stayed)% That Stayed
    FY 2020-21$82 Bn$44.0 Bn54%
    FY 2022-23$71 Bn$28.0 Bn39%
    FY 2023-24$71 Bn$10.6 Bn15%
    FY 2024-25$81 Bn$1.0 Bn1%
    FY 2025-26$95 Bn$7.0 Bn7%

    Source: RBI Bulletin; Ministry of Finance (Lok Sabha reply); CareEdge Ratings.

    Notice the trend: gross FDI is sitting near an all-time high, while net FDI collapsed to almost nothing in FY24-25 and has only partly recovered since. That gap โ€” not the headline number โ€” is the real story of Indian FDI right now.

    2. Why Are Outflows So High?

    Two things are pulling money back out, and both are simpler than they sound.

    • Repatriation: Investors who put money in years ago are now cashing out โ€” selling their stake, taking profits, or exiting the business entirely. In FY23-24 alone, $44 billion was repatriated out of $71 billion that came in.
    • Outward investment: Indian companies are investing more abroad themselves, in their own overseas units and acquisitions. That counts as money leaving too โ€” nearly $65 billion of it between FY24 and FY26.

    Together, these two are eating up almost all the new FDI that arrives. It’s a bit like a bucket with a big hole near the top โ€” you can keep pouring water in, but the level barely rises.

    3. External Reasons โ€” Forces India Doesn’t Control

    • Global money got expensive: Higher interest rates worldwide for much of this decade made investors more cautious and more eager to book profits early.
    • Geopolitical shocks: A conflict in early 2026 triggered a broad “risk-off” mood across emerging markets, India included โ€” investors pulled back everywhere, not just here.
    • Trade tensions: Tighter US trade policy created uncertainty for investors weighing India exposure.
    • Tough competition: Vietnam, Thailand, Taiwan and Malaysia are actively out-marketing India with faster approvals and sharper incentives for the same pool of global capital.
    • A natural exit cycle: A lot of India’s FDI over the last decade came from private equity and venture capital, which is built to exit in 4-7 years by design. Many of those funds are simply reaching maturity at the same time.

    4. Internal Reasons โ€” What’s In India’s Own Hands

    • Land is still hard to acquire: Getting industrial land cleared and ready remains one of the biggest headaches for a company trying to set up operations in India.
    • Labour reforms are stuck: The 2020 labour codes still haven’t been fully implemented โ€” six years on, that delay itself signals unpredictability to investors.
    • Clearances are slow and scattered: Investors dealing with multiple states and departments face a much slower, less predictable path than in Vietnam or Thailand’s single-window systems.
    • Manufacturing FDI is still thin: Real, factory-building manufacturing investment is only about 10.6% of effective inflows โ€” most FDI still goes into services and IT, which don’t need to “stay put” the way a factory does.
    • Domestic capital markets aren’t deep enough: When a foreign investor wants to exit, there often isn’t enough Indian institutional money ready to buy them out โ€” so the money leaves the country instead of just changing hands within it.

    5. What Should India Do to Lift Net FDI?

    • Fast-track approvals with fixed timelines โ€” a genuine time-bound single-window clearance for priority projects, not just a policy promise.
    • Finish the labour code rollout โ€” closing a six-year-old gap matters as much for investor confidence as the content of the codes themselves.
    • Make industrial land ready in advance โ€” pre-cleared land banks and plug-and-play parks, the way parts of Gujarat and Tamil Nadu already do it, need to become the norm across states.
    • Put real muscle behind manufacturing, not FDI in general โ€” sharper, PLI-style incentives specifically for semiconductors, electronics and clean-energy manufacturing.
    • Deepen India’s own capital markets โ€” so that when foreign investors exit, Indian institutions can absorb the stake instead of the money leaving the country.
    • Make Centre-State coordination visible โ€” one senior point of accountability per big project, so approvals don’t get lost between jurisdictions.

    The Bottom Line

    India doesn’t have an attraction problem โ€” the last decade of record gross FDI proves that. What it has is a retention problem: turning a strong “come invest here” pitch into an equally strong “stay and build here” outcome. Fix the handful of structural issues above, and the gap between the $95 billion headline and the $7 billion reality starts closing on its own.

    Sources: DPIIT FDI Factsheets ยท RBI Bulletin ยท PIB ยท Ministry of Finance (Lok Sabha reply) ยท Economic Survey 2025-26 ยท CareEdge Ratings ยท IBEF. Figures compiled and cross-checked as of 22 August 2026.

  • Bread, Rice, Sugar, Oil: A Ten-Year Price Reality Check for Indian Retail

    Bread, Rice, Sugar, Oil: A Ten-Year Price Reality Check for Indian Retail

    What if the biggest inflation story in your kitchen isn’t rice, milk or sugar โ€” but bread?

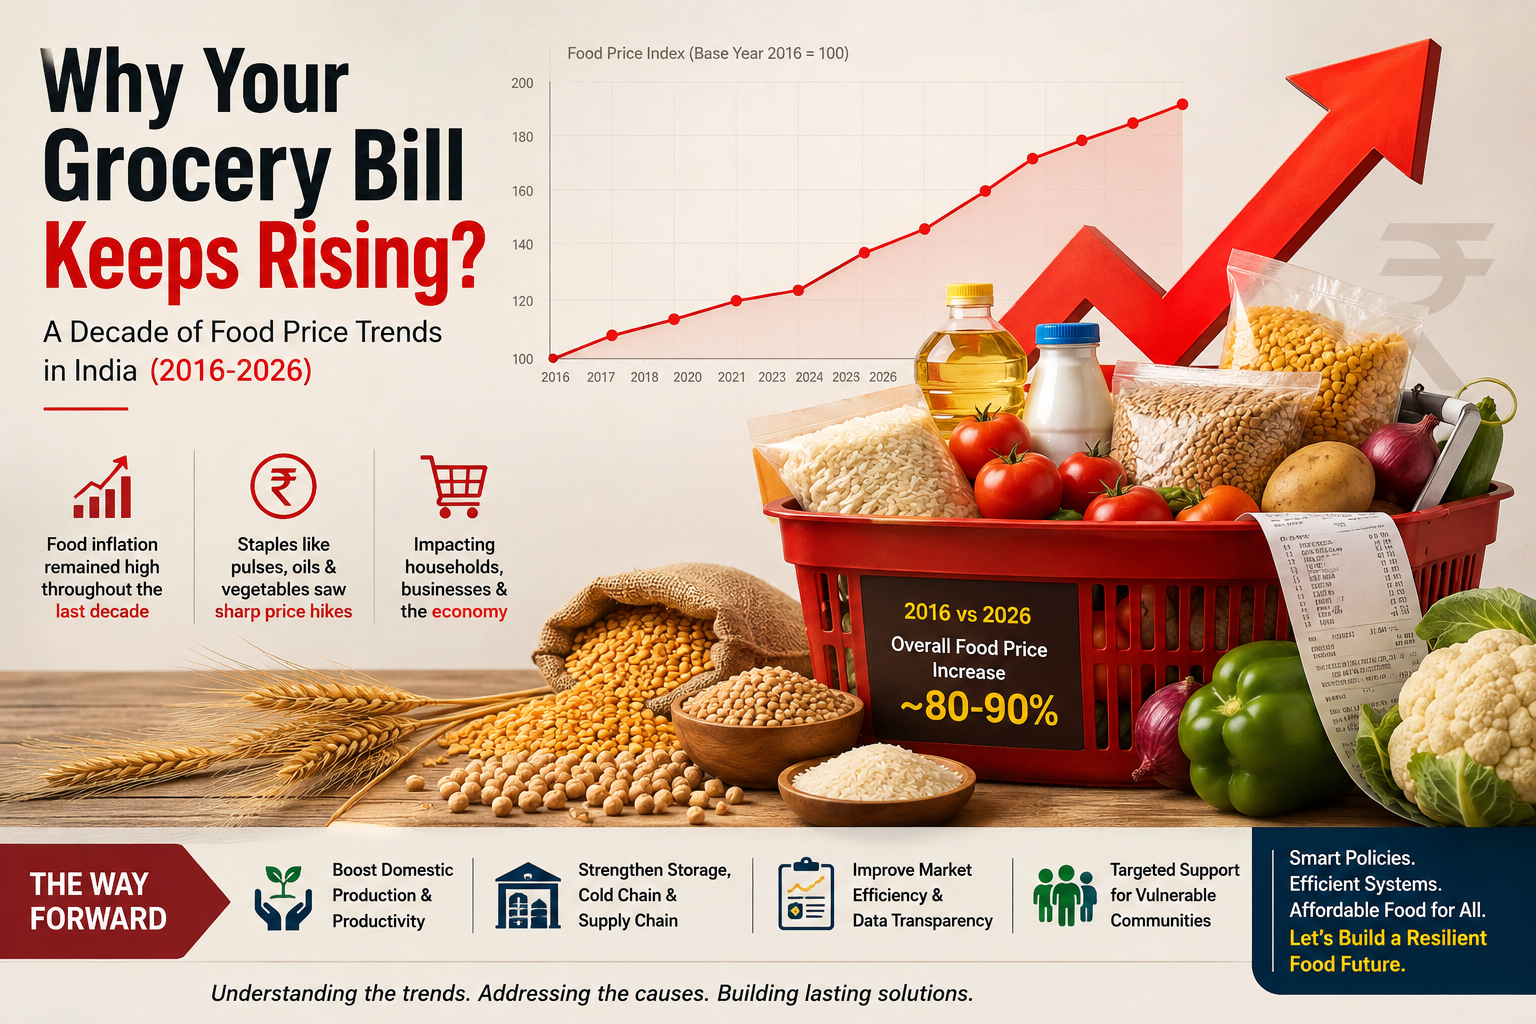
    Over the last decade, India’s everyday food basket has changed dramatically.

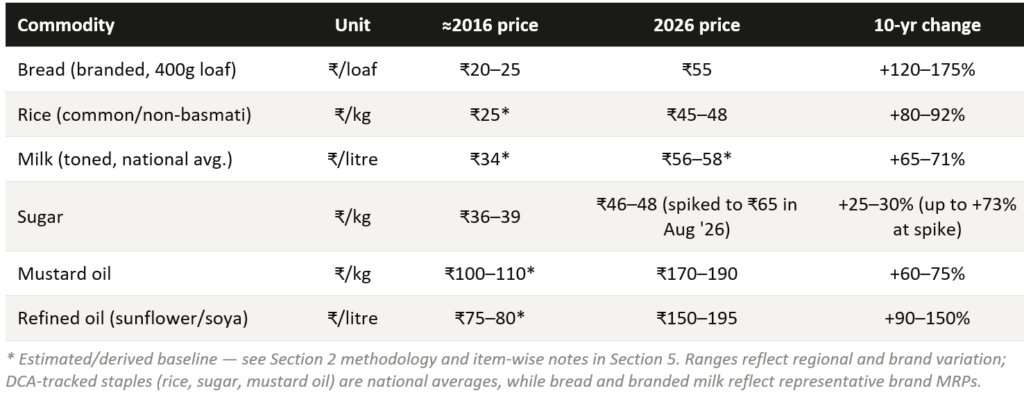
    A standard branded 400g bread loaf that cost roughly โ‚น20โ€“25 around 2016 can now sell for around โ‚น55.

    Rice has moved from roughly โ‚น25/kg to โ‚น45โ€“48/kg.

    Refined cooking oil has experienced even more dramatic volatility.

    Milk has climbed steadily.

    And sugar, after years of relatively moderate movement, has suddenly become a major concern in 2026.

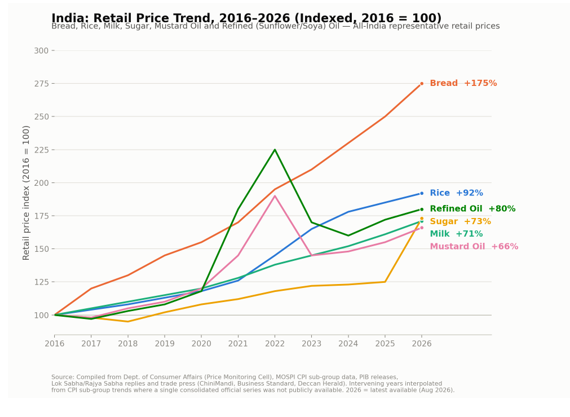
    The supplied 2016โ€“2026 study estimates cumulative increases of approximately 175% for bread, 92% for rice, 80% for refined oil, 73% for sugar, 71% for milk and 66% for mustard oil.

    The numbers are striking.

    But the real story is not the number.

    The real story is what is causing it.


    The 10-year picture

    These are indicative national/representative figures, with some estimated historical baselines and brand/regional differences.


    But food inflation is not one story

    Look at the graph carefully.

    Bread follows a relatively persistent upward trajectory.

    Rice takes a major step upward.

    Edible oils experience a huge shock and then partially correct.

    Sugar remains comparatively controlled for years before suddenly moving sharply.

    Milk rises more steadily.

    That tells us something important: different foods require different inflation-control strategies.


    What is behind the increase?

    Six forces repeatedly appear across these categories.

    1. Higher agricultural support prices

    MSP for crops and FRP for sugarcane provide farmers greater price certainty and income support.

    But higher farm-gate prices can eventually move through procurement, processing and retail.

    The Economic Survey notes that India fixed MSP at 1.5 times the all-India weighted average cost of production, providing farmers greater price certainty.

    The challenge is therefore not whether MSP should exist.

    The question is:

    How do we increase farmer income without creating excessive consumer-price pressure?


    2. India’s dependence on imported edible oils

    This may be the biggest structural vulnerability in this basket.

    India imports a substantial share of its edible-oil requirement.

    That means an event in Indonesia, Malaysia, Argentina, Brazil, Russia or Ukraine can eventually affect the price of cooking oil in an Indian household.

    The 2021โ€“22 global edible-oil shock demonstrated this dramatically.


    3. Global shocks

    The Russiaโ€“Ukraine war disrupted sunflower-oil and other commodity supplies.

    Indonesia’s palm-oil export restrictions created another major shock.

    These events showed that food security is increasingly connected to geopolitical security.


    4. Energy, logistics and packaging

    Bread illustrates this perfectly.

    The consumer sees โ‚น55 for a loaf.

    But behind that โ‚น55 are wheat flour, oil, sugar, yeast, packaging film, energy, labour, transportation, distribution and wastage.

    The study identifies these accumulated costs as a major reason for bread’s unusually high long-term increase.


    5. Government trade and supply policies

    India frequently uses:

    • Export restrictions
    • Import-duty changes
    • Buffer stocks
    • Open-market sales
    • Stock limits
    • Procurement
    • Subsidised retail programmes

    These tools can be extremely effective.

    But timing matters.

    A policy designed to stabilise prices can sometimes create unintended market reactions if supply chains and trader behaviour are not considered.

    The 2026 sugar episode is a good example of why policy design and market communication matter.


    So what can the Government do?

    The answer is not simply to impose price controls.

    Price controls can suppress symptoms temporarily while leaving the underlying supply problem unresolved.

    India needs a combination of short-term intervention and long-term productivity improvement.

    1. Build a stronger food-price early-warning system

    The Government already monitors essential commodity prices.

    The next step should be predictive.

    Track simultaneously:

    Weather โ†’ crop acreage โ†’ yield โ†’ mandi prices โ†’ stocks โ†’ imports/exports โ†’ global prices โ†’ retail prices.

    This would allow intervention before prices become a consumer crisis.

    The Department of Consumer Affairs already operates a Price Monitoring Division for essential commodities.


    2. Use buffer stocks more dynamically

    Where adequate government stocks exist, calibrated releases can reduce temporary shortages.

    The Government has already used Open Market Sale mechanisms for price stability.

    In 2026, the Government reported substantial wheat and rice stocks and continued monitoring of essential commodities.

    The opportunity is to make intervention earlier, targeted and temporary, rather than reacting after a major price spike.


    3. Increase agricultural productivity

    This is perhaps the most sustainable answer.

    The Economic Survey identifies fragmented landholdings, inadequate storage and marketing infrastructure, limited access to quality inputs, low mechanisation and uneven productivity as continuing constraints.

    Higher productivity means:

    more output without proportionately increasing cost.

    That is the most durable form of food-price control.


    4. Reduce edible-oil import vulnerability

    India needs to accelerate domestic oilseed productivity.

    The Economic Survey highlights the National Mission on Edible Oilsโ€“Oilseeds as one of the Government’s initiatives to improve domestic production and productivity.

    Over time, increasing domestic production can reduce India’s exposure to global edible-oil shocks.


    5. Improve storage and cold-chain infrastructure

    A food shortage does not always mean insufficient production.

    Sometimes food exists but cannot move efficiently.

    Better:

    • Warehousing
    • Cold storage
    • Rural roads
    • Packhouses
    • Refrigerated transport
    • Modern mandis
    • Digital market linkages

    can reduce wastage and the gap between farm-gate and retail prices.


    6. Make policy changes more predictable

    Frequent export bans, import-duty changes and stock restrictions can create uncertainty.

    The objective should be:

    Predictable policy + flexible intervention.

    Markets respond better when participants understand the Government’s trigger points and likely response.


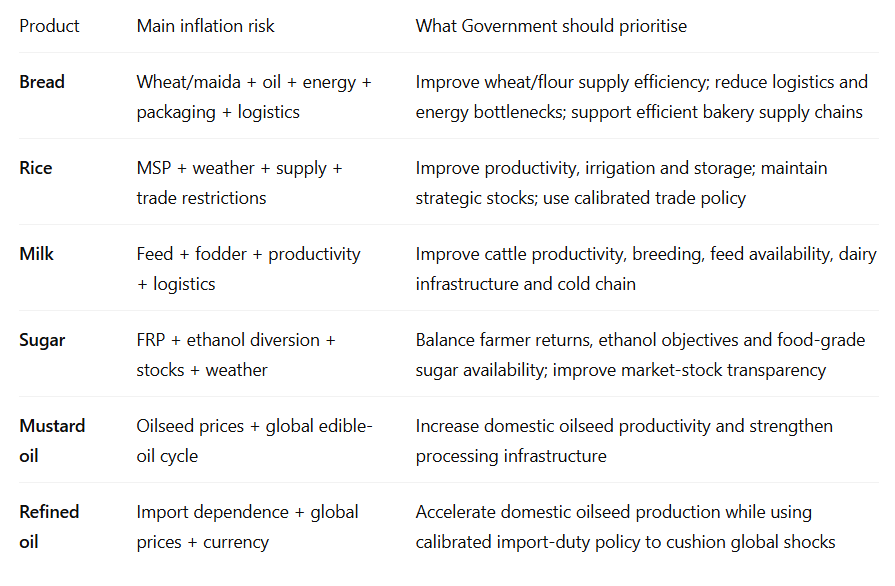
    Product-wise recommendations for Government

    The bigger question for India

    India has made significant progress in food security.

    The next challenge is different.

    It is affordable food security.

    Producing enough food is one objective.

    Producing enough food efficiently, storing it efficiently, moving it efficiently and keeping it affordable is the next.

    And the solution cannot come from one ministry or one policy.

    It requires coordination between:

    Agriculture + Food + Consumer Affairs + Commerce + Finance + Transport + Energy.

    Because the price of a loaf of bread is ultimately influenced by much more than wheat.


    My biggest takeaway

    The last ten years tell us something very clearly:

    Food inflation is becoming increasingly interconnected.

    A war can increase the price of cooking oil.

    A currency movement can increase the landed cost of commodities.

    A weather event can affect rice.

    A feed-price increase can affect milk.

    An ethanol policy can affect sugar.

    And higher packaging and logistics costs can push up the price of bread.

    The consumer sees one number on the shelf.

    Behind that number is an entire economic system.

    India’s next food-policy challenge should therefore move from simply controlling prices after they rise to predicting supply stress before prices rise.

    That is where technology, better agricultural productivity, strategic stocks, predictable trade policy and stronger domestic supply chains can make the biggest difference.

    The goal should not be artificially cheap food.

    The goal should be sustainably affordable food.


    What do you think?

    Should India focus more on price controls, or should the Government invest more aggressively in productivity, storage, domestic oilseed production and supply-chain infrastructure?

    I’d be interested in hearing the views of people working across FMCG, retail, agriculture, food processing and supply chain.

    #IndiaRetail #FoodInflation #FMCG #FoodSecurity #RetailStrategy #SupplyChain #Agriculture #FoodEconomics #ConsumerBusiness #IndiaEconomy #PricingStrategy

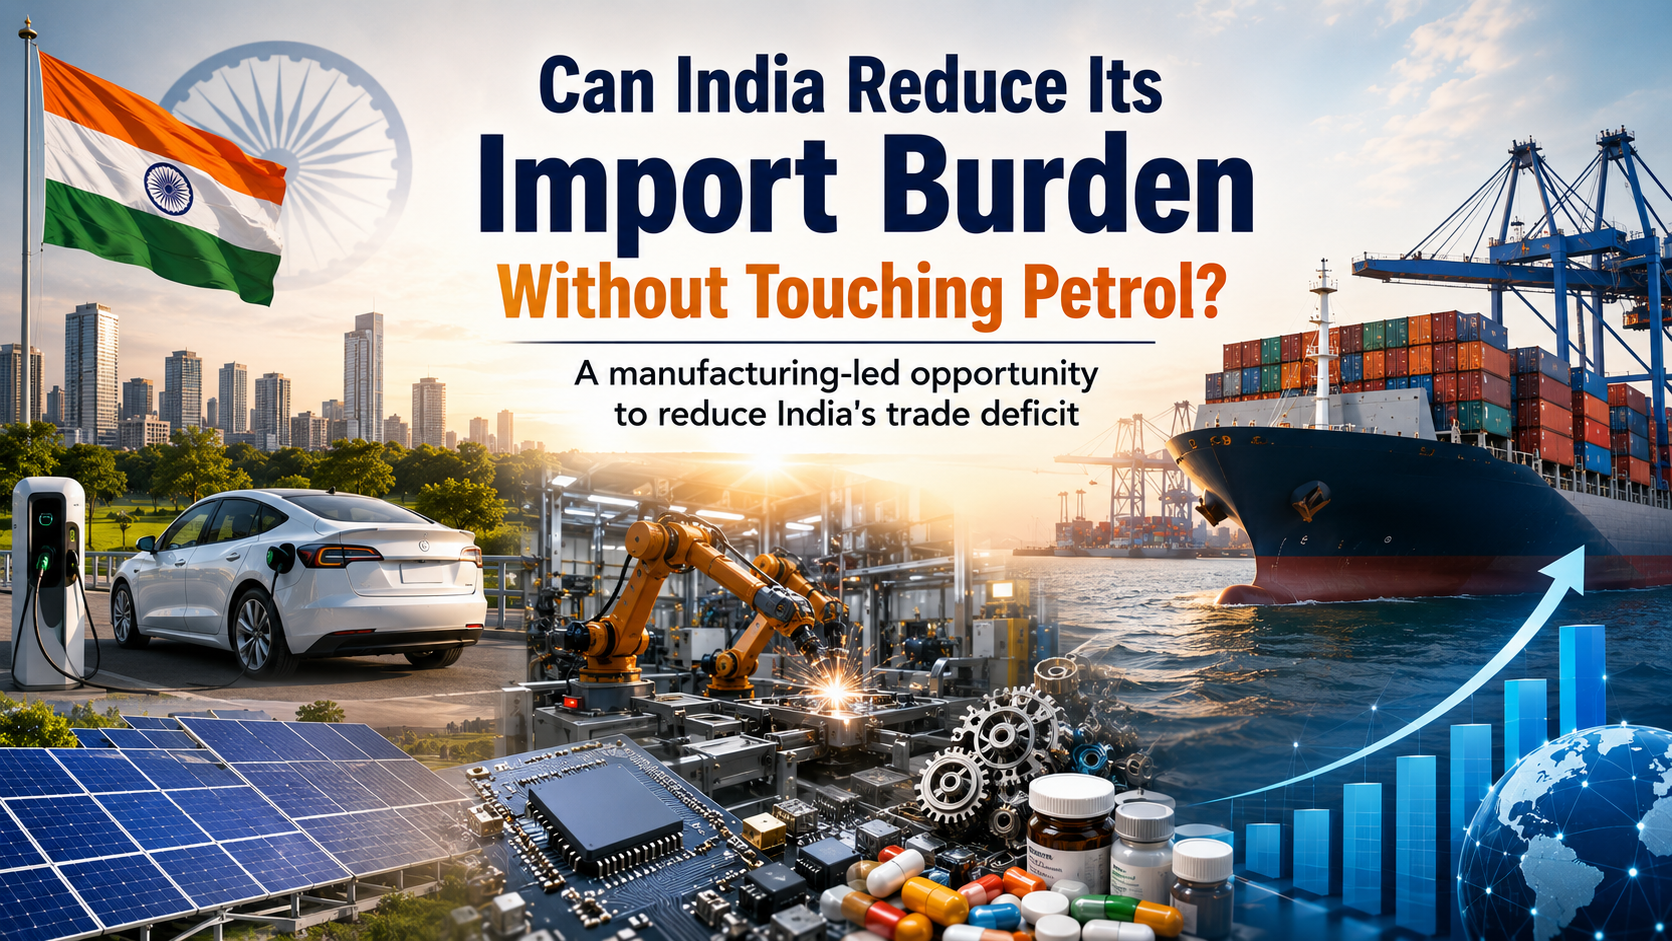
  • Case Study: Can India Reduce Its Import Burden Without Touching Petrol? A manufacturing-led opportunity to reduce India’s trade deficit- Gaurang Govind

    Case Study: Can India Reduce Its Import Burden Without Touching Petrol? A manufacturing-led opportunity to reduce India’s trade deficit- Gaurang Govind

    LinkedIn article | Critical-thinking scenario model

    The hook

    What if India’s import burden is not just a problemโ€”but one of India’s biggest manufacturing opportunities?

    India imported US$721.2 billion of merchandise in FY2024-25, while merchandise exports stood at about US$437.7 billion, leaving a merchandise trade deficit of roughly US$283.5 billion.

    But we need to ask a more intelligent question:

    How much of these imports can India realistically replace through domestic manufacturingโ€”and how much can the resulting manufacturing ecosystem add to exports?

    The challenge: every import is not a bad import

    The answer is not 100% replacement. India imports crude oil because of resource constraints. India imports gold because domestic jewellery manufacturing does not eliminate the need for gold. India imports advanced machinery because some of that machinery actually increases India’s productive capacity and future exports. India imports semiconductors and advanced components because developing the entire upstream ecosystem requires technology, capital and time.

    Therefore, ‘Make everything in India’ is not the right strategy.

    The better objective is: reduce avoidable imports, increase domestic value addition and build industries that can eventually export.

    Where is the real opportunity?

    OpportunityPotential domestic substitutionWhy?
    Pulses & selected agricultural products40โ€“60%India already has the agricultural base.
    Edible / vegetable oils40โ€“55%Productivity and processing opportunity.
    Toys, footwear, consumer goods & finished plastics50โ€“80%Existing manufacturing capability and lower technology barriers.
    Electronics & components25โ€“50%Large opportunity, but imported inputs remain important.
    Telecom equipment40โ€“60%Domestic engineering capability, but high-end components remain constrained.
    Computer hardware30โ€“50%Assembly is easier than deep component localisation.
    Specialty chemicals20โ€“40%Technology, feedstock and scale constraints.
    Selected capital goods20โ€“40%Build domestic capability selectively; productive imports can be beneficial.

    The interesting point is that some of the best opportunities are not necessarily India’s largest import categories. There are hundreds of smaller products where India could potentially achieve 50โ€“90% domestic value addition.

    Three scenarios

    Using the FY2024-25 merchandise import base of US$721.2 billion, I have modelled three scenarios for non-petroleum import substitution.

    ScenarioGross import substitutionApprox. share of imports
    ConservativeUS$42 bn5.9%
    Base / realisticUS$63 bn8.7%
    Strong transformationUS$88 bn12.2%

    But there is an important correction. If India manufactures something domestically, it may still import raw materials, components, technology and machinery. Therefore, US$63 billion of gross import substitution does not mean US$63 billion of net foreign-exchange saving.

    In the base scenario, the estimated net foreign-exchange retention is approximately US$42 billion.

    Then comes the second opportunity: exports

    If India manufactures only for its domestic market, imports fall but exports do not necessarily change. If these new industries become globally competitive, India gets both import substitution and export growth.

    Suppose the new manufacturing ecosystem increases merchandise exports by approximately 7%. On the FY2024-25 export base, that represents roughly US$30.6 billion of additional exports.

    Again, this is not treated as a free benefit. The model allows approximately 30% of incremental export value for imported inputs, so the trade benefit is not overstated.

    And then we have the EV opportunity

    This is a separate lever. India’s petrol and diesel consumption is enormous. If EV adoption reaches 25%, the impact should not be modelled as a simple 25% reduction in oil imports.

    Vehicle mix, kilometres travelled, two-wheelers versus cars, buses and trucks, charging availability and petroleum’s non-road uses all matter. India also exports refined petroleum products, while batteries and EV components can themselves create imports.

    Base EV assumption: 25% EV adoption โ†’ approximately 20% displacement of petrol + diesel demand.

    Under this model, that could translate into approximately US$14.9 billion of annual crude-import-value saving.

    This is separate from the manufacturing saving. And EV adoption should ideally be accompanied by domestic battery, motor, power-electronics and charging-equipment manufacturing so that the oil saving is not partly replaced by a new EV import bill.

    Put the three levers together

    ContributionImpactComment
    Manufacturing import savingUS$64.9 bnBase non-petroleum manufacturing scenario
    EV petroleum-import savingUS$14.9 bn25% EV adoption / base fuel-displacement scenario
    TOTAL DIRECT IMPORT SAVINGUS$79.8 bnManufacturing + EV
    Additional merchandise exportsUS$30.6 bnApprox. 7% export increase
    Imported inputs for additional exports~US$9.2 bn30% analytical allowance
    Indicative trade-deficit improvement~US$110 bnCombined scenario
    IndicatorFY2024-25 OLDCentral scenario / NEW
    Merchandise importsUS$721.2 bnApproximately US$641.4 bn
    Merchandise exportsUS$437.7 bnApproximately US$468.3 bn
    Merchandise trade deficitUS$283.5 bnApproximately US$173.1 bn

    Central scenario: approximately US$110 billion improvement in the merchandise trade deficit, or roughly 39% of the FY2024-25 deficit.

    But here is the most important point

    India should not stop at assembly.

    Take electronics. If India assembles a โ‚น100 product but imports โ‚น70 worth of components, the foreign-exchange benefit is limited.

    The real opportunity is: Assembly โ†’ Components โ†’ Materials โ†’ Technology โ†’ Scale โ†’ Exports.

    The same principle applies to EVs: EVs โ†’ batteries โ†’ cells โ†’ power electronics โ†’ motors โ†’ components.

    And to chemicals: chemicals โ†’ intermediates โ†’ specialty chemicals โ†’ global exports.

    Where India should NOT spend maximum effort

    • Crude oil โ€” a resource constraint. EVs, energy efficiency and alternative energy matter more.
    • Gold โ€” domestic jewellery manufacturing does not remove the underlying gold import.
    • Advanced semiconductors โ€” a long-term strategic opportunity, but not a quick import-substitution solution.
    • Advanced machinery โ€” productive capital-goods imports can strengthen domestic output and exports; blanket substitution can reduce competitiveness.

    Top 5 focus areas

    1. Domestic value addition โ€” measure how much of the product’s value is actually created in India.
    2. Import substitution where resources already exist โ€” oilseeds, pulses, food processing, footwear, toys, consumer goods and selected plastics.
    3. Electronics & components โ€” move beyond assembly into components and materials.
    4. Export-oriented manufacturing โ€” every major import-substitution programme should ask: ‘Can we eventually export this product?’
    5. EV + domestic component ecosystem โ€” combine lower petroleum demand with Indian battery, motor, electronics and charging capability.

    The real question for India

    India does not need to become an import-free economy. That would be neither practical nor economically desirable.

    India needs to become a high-domestic-value-add economy.

    If India can simultaneously reduce avoidable imports, increase domestic manufacturing, increase exports, reach 25% EV adoption over time and build the domestic EV/electronics supply chain, the merchandise trade deficit could potentially fall dramatically.

    The central scenario suggests a possible ~US$110 billion improvement.

    But the real prize is much bigger than that number. It is the creation of Indian capabilityโ€”jobs, technology, suppliers, investment, productivity, exports and recurring foreign-exchange earnings.

    So perhaps the question India should ask is no longer: ‘How much can we stop importing?’

    ‘How much value can India create from every dollar it currently importsโ€”and how much of that value can we ultimately sell to the world?’

    Data & methodology note

    FY2024-25 merchandise trade figures are from Government of India Department of Commerce/DGCI&S data. The Department reports merchandise imports of US$721.20 billion, exports of US$437.70 billion and a merchandise trade deficit of US$283.50 billion.

    The substitution percentages, export-growth assumption, imported-input allowance and EV savings are analytical scenario assumptions, not Government forecasts. The model should be upgraded to HS-code-level BOM/input-output analysis before being used as a formal policy estimate.

    Primary references: Government of India, Department of Commerce Annual Report 2025-26; Department of Commerce TradeStat; PPAC petroleum data; Government of India agriculture and chemicals data.