
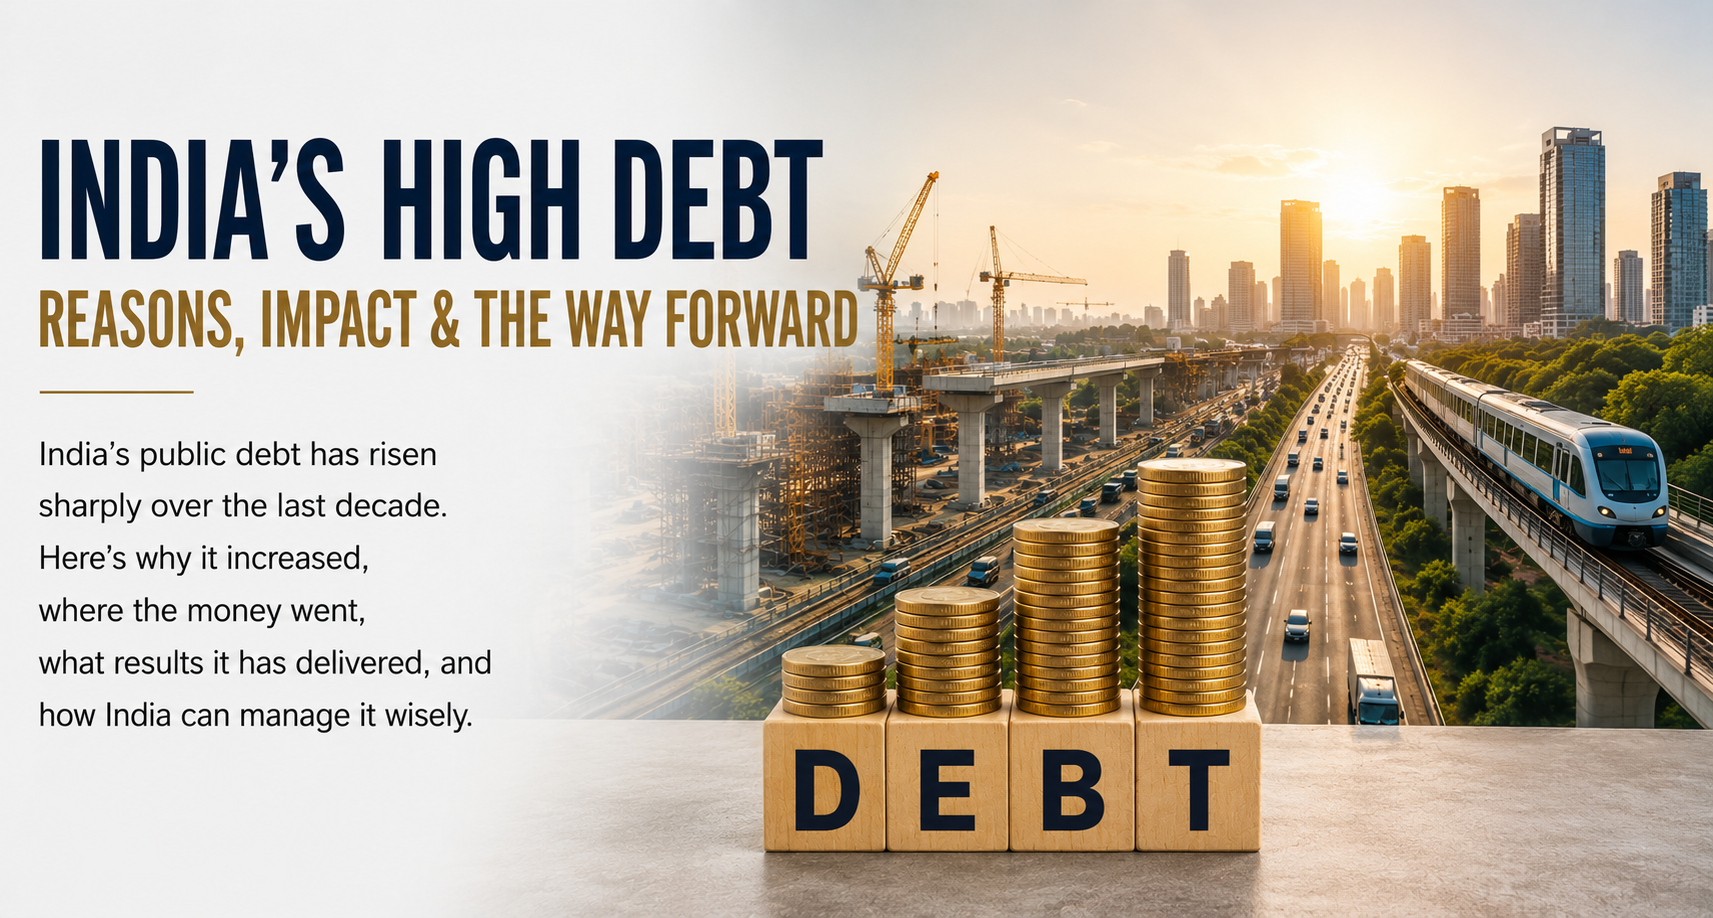
India’s Public Debt Story (2015–2025): What a Decade of Borrowing Actually Bought Us. Are we in a Debt Trap?
India’s combined government debt has roughly doubled over the past decade. Central government debt alone climbed from about ₹121 trillion in FY2020 to an estimated ₹197 trillion by FY2026. State liabilities nearly tripled, from ~₹32.6 trillion in FY2016 to ~₹94 trillion by FY2025.
Numbers like these trigger one of two reactions: alarm or indifference. Neither is entirely right.
The better question is: What drove this rise, where did the money go, and where does it leave India today?
Here’s the decade, unpacked.
The pattern: steady drift, then a shock, then a slow climb-down
Pre-2020, India’s fiscal deficit sat in a fairly disciplined 3–4% of GDP band, broadly consistent with FRBM targets — even if actual numbers occasionally missed the mark (FY2019 came in around 3.4% against a 3.3% target).
Then COVID hit. The central fiscal deficit spiked to roughly 9.5% of GDP in FY2021 as revenue collapsed and emergency spending — cash transfers, free food grain, MSME credit guarantees, health spending — went out the door. Debt-to-GDP jumped by an estimated 8–10 percentage points in a single year.
Since then, the story has been consolidation: the deficit has been brought down to around 5–6% of GDP, with a budgeted target of 4.4% for FY2026. It’s real progress, even if the debt base it’s working off is now structurally higher than it was five years ago.
Three episodes that explain most of the swings Debt to GDP ratio %
Demonetisation (Nov 2016): Intended to curb black money and push digital transactions, it also slowed activity and tax collections in the short run — GDP growth cooled and the fiscal deficit widened modestly (to around 3.5% of GDP against a 3% target) in FY2017.
GST rollout (Jul 2017): A genuine structural reform with long-term revenue upside, but the transition wasn’t free. Collections initially undershot expectations, and the Centre had to borrow to compensate states during the changeover — nudging FY2018’s deficit above target.
COVID-19 (2020–21): By far the biggest driver. A relief package of ₹20 trillion, layered onto a collapsing revenue base, took the deficit from roughly 3.5% to 9.5% of GDP in one year. Was it worth it? Most independent analyses — including from the IMF and RBI — suggest yes: the counterfactual (a sharper austerity response) likely meant a materially deeper contraction. The trade-off was a permanently higher debt stock in exchange for a shallower recession.
Add to this two smaller but persistent pressures: periodic PSU bank recapitalisation (roughly ₹2.2 trillion across FY2018 and FY2020, needed to clean up bad loans) and an expanding footprint of welfare and housing schemes (PMAY, Ujjwala, MGNREGA) that keep revenue spending elevated even as capital expenditure has also been rising.
The quiet number that matters most: interest payments
Debt totals get the headlines, but the number that actually constrains policy choices is the interest bill. Central government interest payments rose from about ₹6.6 trillion in FY2020 to roughly ₹8.1 trillion by FY2022 and now consume somewhere in the range of 20–25% of central revenue receipts. That’s revenue that isn’t available for capex, subsidies, or further consolidation — it’s simply the cost of past borrowing. As global and domestic interest rates moved up through 2022–23, this burden has only gotten heavier.
Where did the borrowed money go?
It helps to separate how much India borrowed from what it was spent on. The story changed significantly after COVID:
- FY2020–21: Borrowing largely supported emergency needs — food distribution, welfare support, MSMEs and bank recapitalisation. Necessary at the time, but with limited long-term growth impact.
- FY2022–24: The focus shifted toward capital expenditure — roads, railways, healthcare and infrastructure. Capex as a share of GDP steadily increased.
The positive shift: India increasingly moved from borrowing to support consumption toward borrowing to build productive assets.
The road ahead
The government’s own glide path targets a fiscal deficit closer to 4% of GDP, with debt-to-GDP expected to ease from its COVID-era peak (above 60%) toward the high-50s by FY2026. Getting there sustainably will likely depend on a few things playing out together: continued nominal GDP growth outpacing debt growth, disciplined targeting of subsidies rather than blanket cuts, tighter oversight of contingent liabilities and off-budget borrowing (state guarantees, PPP obligations), and a continued shift of the expenditure mix toward capital rather than revenue spending.
None of this is dramatic. Fiscal consolidation rarely is — it’s mostly the unglamorous work of holding a line over several budget cycles. But the direction, so far, has been the right one.
The takeaway
The last decade brought demonetisation, GST, COVID-19 and a major infrastructure push. As a result, India’s public debt is roughly twice what it was in 2016.
But debt is only one side of the story. India also built a stronger digital payments ecosystem, a unified tax system and significantly better infrastructure, while managing a strong post-COVID recovery.
The key question now isn’t how much India owes, but whether economic growth can continue to outpace the growth in debt.
What’s your read — was the post-COVID borrowing surge the right call, or did it set a debt base that will constrain policy for years to come? Would like to hear other perspectives on this.
#IndianEconomy #PublicFinance #FiscalPolicy #Macroeconomics #Debt #Budget2026 #EconomicPolicy #India